The Inverted Yield Curve: Your Personal Finance Recession Warning?
💡 Quick Tip
Uncover how the yield curve acts as a crucial economic barometer. Learn to interpret its signals and understand why its inversion has preceded almost every recession in history. This insight will empower you to make more informed financial decisions.
As your guide through the often-complex world of personal finance, I want to share a powerful tool today. It's called the yield curve, and while its name might sound daunting, it's an incredibly useful barometer for understanding what might be brewing in the economic future.
Don't let the name intimidate you. Think of it as the market's quiet oracle, subtly hinting at what's ahead. Historically, it's proven to be one of the most astonishingly accurate signals for predicting significant economic shifts, especially recessions.
What is the Yield Curve?
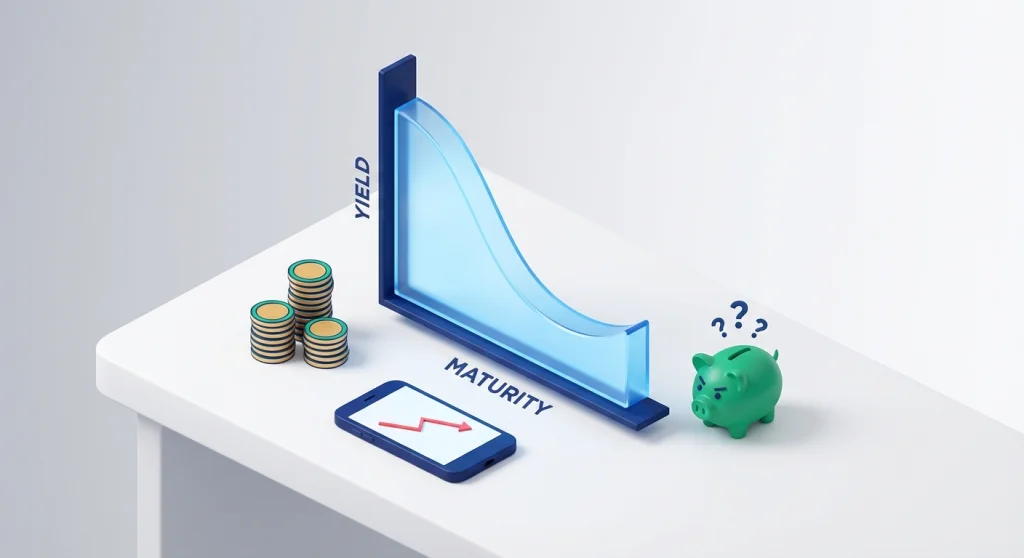
Simply put, the yield curve is a graph that plots the interest rates (or yields) of government bonds—like US Treasury bonds—that have the same credit quality but different maturity dates (for instance, 3 months, 2 years, 10 years, or 30 years).
Normally, this curve is upward sloping. Why? Because when you lend your money for a longer period, you typically expect greater compensation—a higher interest rate—to account for the increased risk and uncertainty of having your funds tied up. You'd naturally expect to earn more on a 10-year bond than on a 1-year bond.
The Normal vs. The Inverted Curve
- Normal Yield Curve (Upward Sloping): Long-term interest rates are higher than short-term rates. This signals healthy economic growth and often anticipates future inflation and rising interest rates.
- Flat Yield Curve: Short-term and long-term rates are very similar. This can suggest a pause in economic growth or heightened uncertainty.
- Inverted Yield Curve (Downward Sloping): This is where the warning bells start ringing! It means that short-term interest rates are higher than long-term rates. In essence, you'd earn more for lending your money for 3 months than for 10 years. This is abnormal.
Why the Inverted Yield Curve Predicts Recessions?
The inversion of the yield curve is a significant red flag for several reasons:
- Lack of Future Confidence: Investors are willing to accept lower long-term returns because they anticipate a significant economic slowdown ahead. They expect short-term interest rates to plummet dramatically once a recession hits. So, they prefer a lower but stable long-term yield in the face of an uncertain economic future.
- Trouble for Banks: Banks primarily profit by borrowing money short-term (paying lower rates) and lending it out long-term (charging higher rates). When the curve inverts, their profit margin—the 'spread'—shrinks dramatically. This discourages lending, which can significantly slow down economic activity.
- Impeccable Track Record: Since the 1970s, the inversion of the US Treasury yield curve (particularly the spread between the 2-year and 10-year yields) has preceded almost every recession with astonishing reliability. This isn't just a coincidence; it's a powerful predictive signal.
How This Affects Your Personal Finances
This isn't meant to spark panic, but rather to empower you with knowledge. If you see the yield curve invert, it doesn't mean a recession is hitting tomorrow, but it is a wise time to:
- Review your finances: Ensure you have a robust emergency fund in place.
- Evaluate your debts: Consider consolidating high-interest debt or securing fixed rates if you have variable-rate loans.
- Diversify your investments: Make sure your portfolio is well-diversified and prepared for various economic scenarios.
The yield curve isn't a perfect crystal ball, but it is, without a doubt, one of the most respected tools for anticipating economic shifts. Understanding it gives you a crucial advantage to navigate your personal finances more wisely.
📊 Practical Example
Imagine Laura, 40, with $10,000 in savings and a variable-rate mortgage of $180,000. In a normal yield curve scenario, she might invest her $10,000 in a 5-year Certificate of Deposit (CD) offering 2.5% annually, expecting stable economic growth.
However, the yield curve inverts: now, a 1-year CD pays 4%, while a 5-year CD only offers 3%. Laura might be tempted to put her $10,000 into the 1-year CD to maximize short-term returns, anticipating rates could fall later. But this inverted curve also signals caution. She knows that higher short-term rates could soon impact her variable-rate mortgage, potentially increasing her monthly payment from, say, $1,500 to $1,650. Recognizing this signal, Laura decides not only to choose the 1-year CD but also to increase her emergency fund and explore refinancing to a fixed-rate mortgage before rates climb further and strain her monthly cash flow. Her goal is to prepare for a potential recessionary scenario.